Importance of Random Column Selection / 随机列选择的重要性
Sometimes one feature will dominate in finance. If you don’t apply some type of random feature selection, then your trees will not be that different (i.e., will be correlated) and that reduces the benefit of ensembling.
有时,一项特征将在财务数据中占主导地位。 如果您不应用某种类型的随机特征选择,那么您的树将不会有太大的不同(即, 他们之间的相关性太高),从而降低了集成(ensembling)的好处。
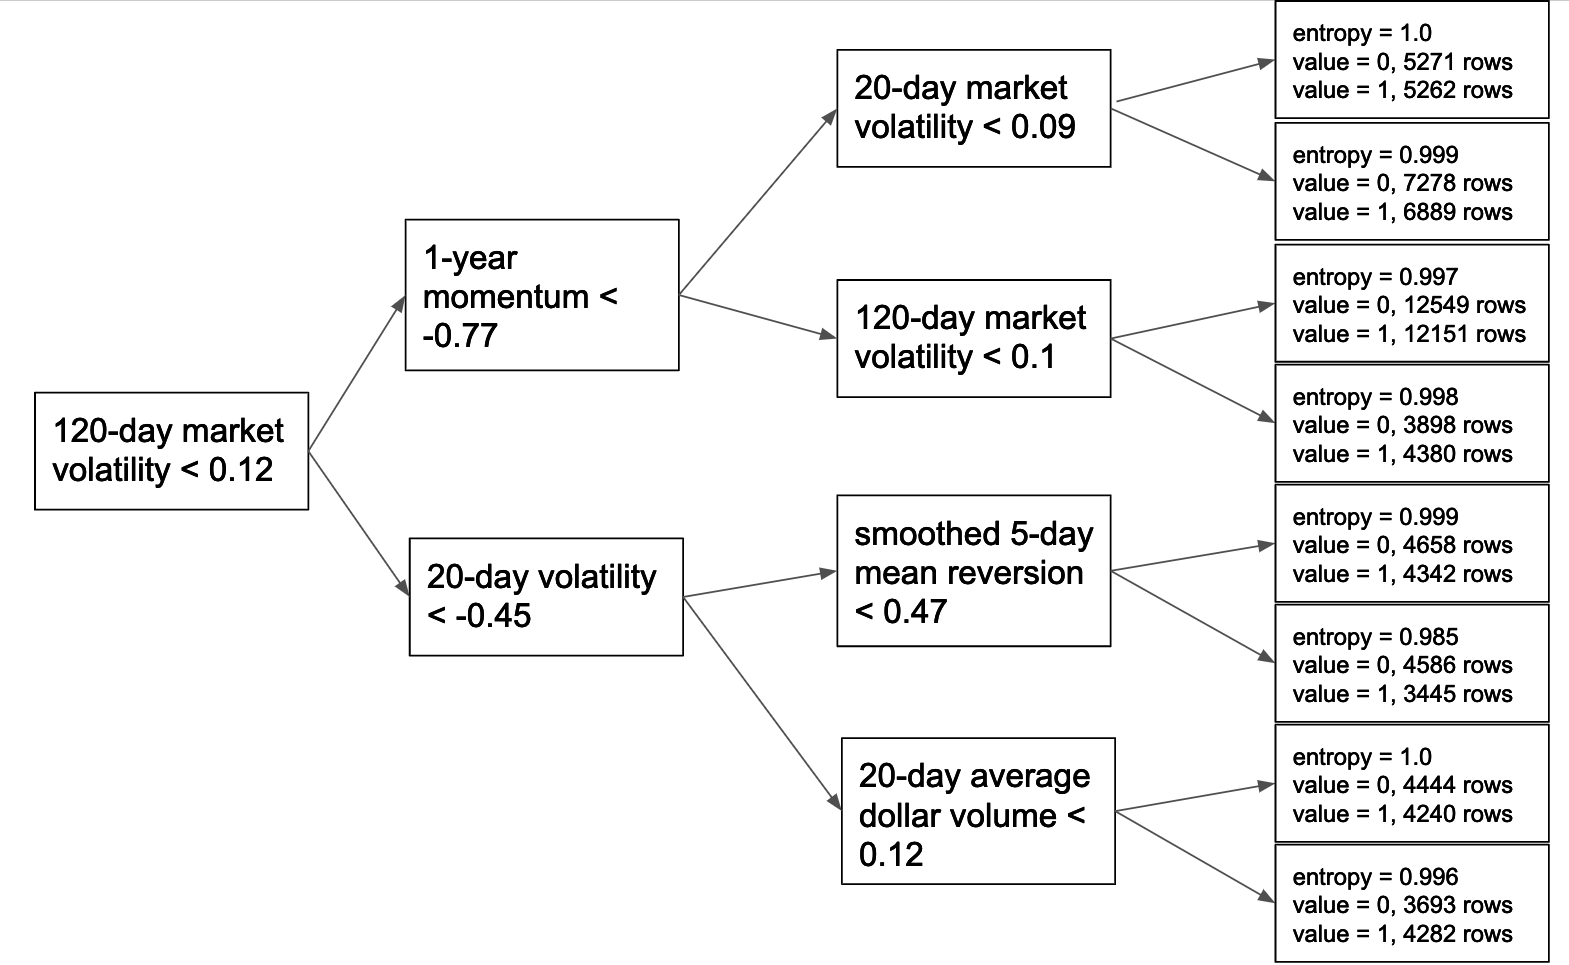
What features are typically dominant? Classical, price-driven factors, like mean reversion or momentum factors, often dominate. You may also see that features that define industry sectors or market “regimes” (periods defined, for example, by high or low market volatility or other market-wide trends) are towards the root of the tree.
典型地,价格驱动的因子(例如均值回归或动量因子)通常占主导地位。 您还可能会看到,定义行业部门或市场“制度”的特征(例如,由高或低的市场波动性或其他市场趋势确定的时期)都会靠近树的根部。
Choosing Hyperparameter Values / 选择超参数
In non-financial and non-time series machine learning, setting this hyperparameter is fairly straightforward: you use grid search cross-validation to find the value that maximizes the model’s performance on validation data. When you have time-series data, you typically don’t use cross-validation because usually you just want a single validation dataset that is as close in time as possible to the present. If you have a problem with high signal-to-noise, then you can try a bit of parameter tuning on the single validation set. In finance, though, you have time series data and you have low signal-to-noise. Therefore, you have one validation set and if you were to try a bunch of parameter values on this validation set, you would almost surely be overfitting. As such, you need to set the parameter with some judgement and minimal trials.
在非金融和非时间序列的机器学习中,设置超参数非常简单:您可以使用网格搜索交叉验证来找到使模型在验证数据上的性能最大化的值。当您拥有时间序列数据时,通常不使用交叉验证,因为通常您希望验证集对应的时间越晚越好(译注: 理由可以见这里)。如果信噪比过高,可以在单个验证集中尝试一些参数调整。但是,在金融领域,您有时间序列数据,信噪比也很低。鉴于只有一个验证集,如果要在此验证集上尝试一堆参数值,则几乎肯定会过拟合。因此,您需要通过一些判断和最少的尝试来设置参数。
Random Forests for Alpha Combination / 用于Alpha组合的随机森林

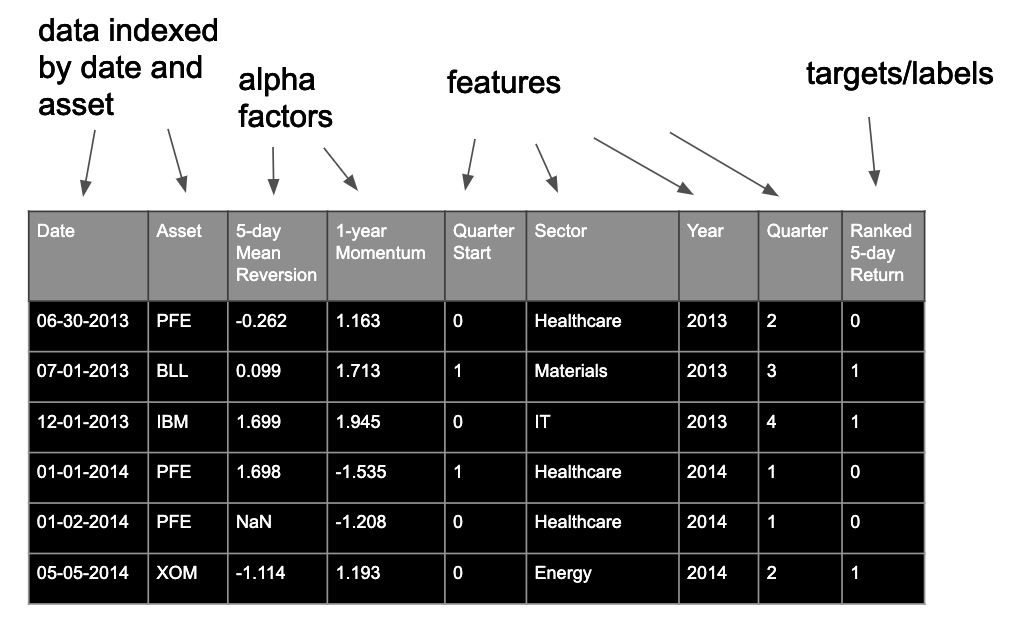
For this type of problem, we have data that look like the above. Each row is indexed by both date and asset. We typically have several alpha factors, and we then calculate “features”, which provide the random forest model additional information. For example, we may calculate date features, which the algorithm could use to learn that certain factors are particularly predictive during certain periods.
对于这种类型的问题,我们有类似上面的数据。 每行都按日期和资产编制索引。 通常,我们有几个alpha因子,然后我们计算“特征”,这些特征为随机森林模型提供了其他信息。 例如,我们可以计算日期特征,该算法可用于了解某些因素在某些时期特别具有预测性。
What are we trying to predict? We’re trying to predict asset returns—but not their decimal values! We rank them relative to each other into only two buckets, such that we essentially predict winners and losers on the day. T
我们要预测什么? 我们正在尝试预测资产收益,但不能预测其十进制值! 我们将它们彼此相对地分为两个等级,这样我们就可以基本上预测当天的赢家和输家。
Source: AI for Trading, Udacity
发表回复