标签: AI for Trading

  • Backtest Best Practices 股票回测的最佳实践

    Use cross-validation to achieve just the right amount of model complexity.
    使用交叉验证来实现适当数量的模型复杂性。

    Always keep an out-of-sample test dataset. You should only look at the results of a test on this dataset once all model decisions have been made. If you let the results of this test influence decisions made about the model, you no longer have an estimate of generalization error.
    始终保持样本外测试数据集。做出所有模型决策后,您只应查看此数据集上的测试结果。如果让此测试的结果影响有关该模型的决策,则您将不再具有泛化误差的估计值。

    Be wary of creating multiple model configurations. If the Sharpe ratio of a backtest is 2, but there are 10 model configurations, this is a kind of multiple comparison bias. This is different than repeatedly tweaking the parameters to get a sharpe ratio of 2.
    小心创建多个模型配置。如果回测的夏普比率为2,但是有10个模型配置,则这是一种多重比较偏差。这与反复调整参数以得到夏普率=2不同。

    Be careful about your choice of time period for validation and testing. Be sure that the test period is not special in any way.
    请谨慎选择验证和测试的时间段。确保测试期不以任何方式特殊。

    Be careful about how often you touch the data. You should only use the test data once, when your validation process is finished and your model is fully built. Too many tweaks in response to tests on validation data are likely to cause the model to increasingly fit the validation data.
    请注意您多久接触一次数据。验证过程完成且模型完全构建后,您仅应使用一次测试数据。对验证数据的测试做出的太多调整很可能导致模型越来越适合验证数据。

    Keep track of the dates on which modifications to the model were made, so that you know the date on which a provable out-of-sample period commenced. If a model hasn’t changed for 3 years, then the performance on the past 3 years is a measure of out-of-sample performance.
    跟踪对模型进行修改的日期,以便您知道可证明的超出样本期限的开始日期。如果模型已经3年没有变化,那么过去3年的性能就是衡量样本外性能的指标。

    Traditional ML is about fitting a model until it works. Finance is different—you can’t keep adjusting parameters to get a desired result. Maximizing the in-sample sharpe ratio is not good—it would probably make out of sample sharpe ratio worse. It’s very important to follow good research practices.
    传统的ML就是在模型起作用之前对其进行拟合。金融数据的ML有所不同-您无法不断调整参数以获得理想的结果。最大化样本内夏普比率不是很好-可能会使样本外夏普比率变得更糟。遵循良好的研究规范非常重要。

    How does one split data into training, validation, and test sets so as to avoid bias induced by structural changes? It’s not always better to use the most recent time period as the test set, sometimes it’s better to have a random sample of years in the middle of your dataset. You want there to be nothing SPECIAL about the hold-out set. If the test set was the quant meltdown or financial crisis—those would be special validation sets. If you test on those time periods, you would be left with the unanswerable question: was it just bad luck? There is still some value in a strategy that would work every year except during a financial crisis.
    如何将数据分为训练,验证和测试集,以避免结构变化引起的偏差?使用最近的时间段作为测试集并不总是更好,有时最好在数据集中使用几年的随机样本。您希望保留集(hold-out set)没有特别之处。如果测试集是量化崩溃或金融危机,那将是特殊的验证集。如果在这些时间段进行测试,那么您将面临一个无法回答的问题:这只是运气不好吗?除了在金融危机期间,每年都可以使用的策略还有一些价值。

    Alphas tend to decay over time, so one can argue that using the past 3 or 4 years as a hold out set is a tough test set. Lots of things work less and less over time because knowledge spreads and new data are disseminated. Broader dissemination of data causes alpha decay. A strategy that performed well when tested on a hold-out set of the past few years would be slightly more impressive than one tested on a less recent time period.
    Alpha会随着时间的流逝而衰减,因此可以说使用过去3或4年作为保留时间集是一个艰难的测试集。随着知识的传播和新数据的传播,随着时间的流逝,许多事情越来越少。数据的广泛传播会导致alpha衰减。在过去几年的保留测试中,一项性能良好的策略比在最近一段时间进行测试的策略更具吸引力。

    Source/来源: AI for Trading, Udacity

  • Note: Overlapping labels 重叠的标签, AI for Trading

    问题

    重叠标签(overlapping labels)问题是使用金融数据训练预测模型遇到的一个问题。如下图所示,假设我们要训练一个模型预测未来一周的收益,最简单的情况下我们会用某一天T的后一周连续收益作为训练的标签(label, i.e. 那个y)。这样每天的样本例子都有一个未来一周的label对应。但由于金融数据有自相关性,连续几天的label通常是相互关联的——这就和大多数机器学习模型的假设冲突,因为这些模型通常假设我们输入的每个样本间是独立同分布的(independent and identically distributed, IID)。
    example-overlapping-labels.png

    以随机森林(Random Forest)模型为例,如果按照上述样本进行训练,那么一个bag里面的样本很容易互相关联,out-bag的样本也亦如此,于是生成的各个决策树就比较相似,最终导致生成的森林的error rate上升——他们太相似了。

    解决方案1:sum-sampling 子采样

    example-subsample.png
    如上图,若要训练的目标是未来一周的收益,可以子采样每周五的未来一周收益。这种方法的缺陷很明显,就是少了很多训练数据。设想一下如果预测目标是未来一月或是一年的收益,训练数据就被删的所剩无几了。

    解决方案2:调整随机森林的bagging过程

    减少每次bag的样本数量,这样一个bag里的样本相关性就会降低。

    解决方案3:轮动数据

    rf-subsample-and-ensemble.png
    基于方案1,假设我们还是要未来一周收益,那么可以训练5个不同的模型,分别子采样周一、周二、…、周五的数据,最后合并这五个森林。

    (更多…)

  • 笔记 – Tree-based models with financial data, AI for Trading

    Importance of Random Column Selection / 随机列选择的重要性

    Sometimes one feature will dominate in finance. If you don’t apply some type of random feature selection, then your trees will not be that different (i.e., will be correlated) and that reduces the benefit of ensembling.
    有时,一项特征将在财务数据中占主导地位。 如果您不应用某种类型的随机特征选择,那么您的树将不会有太大的不同(即, 他们之间的相关性太高),从而降低了集成(ensembling)的好处。

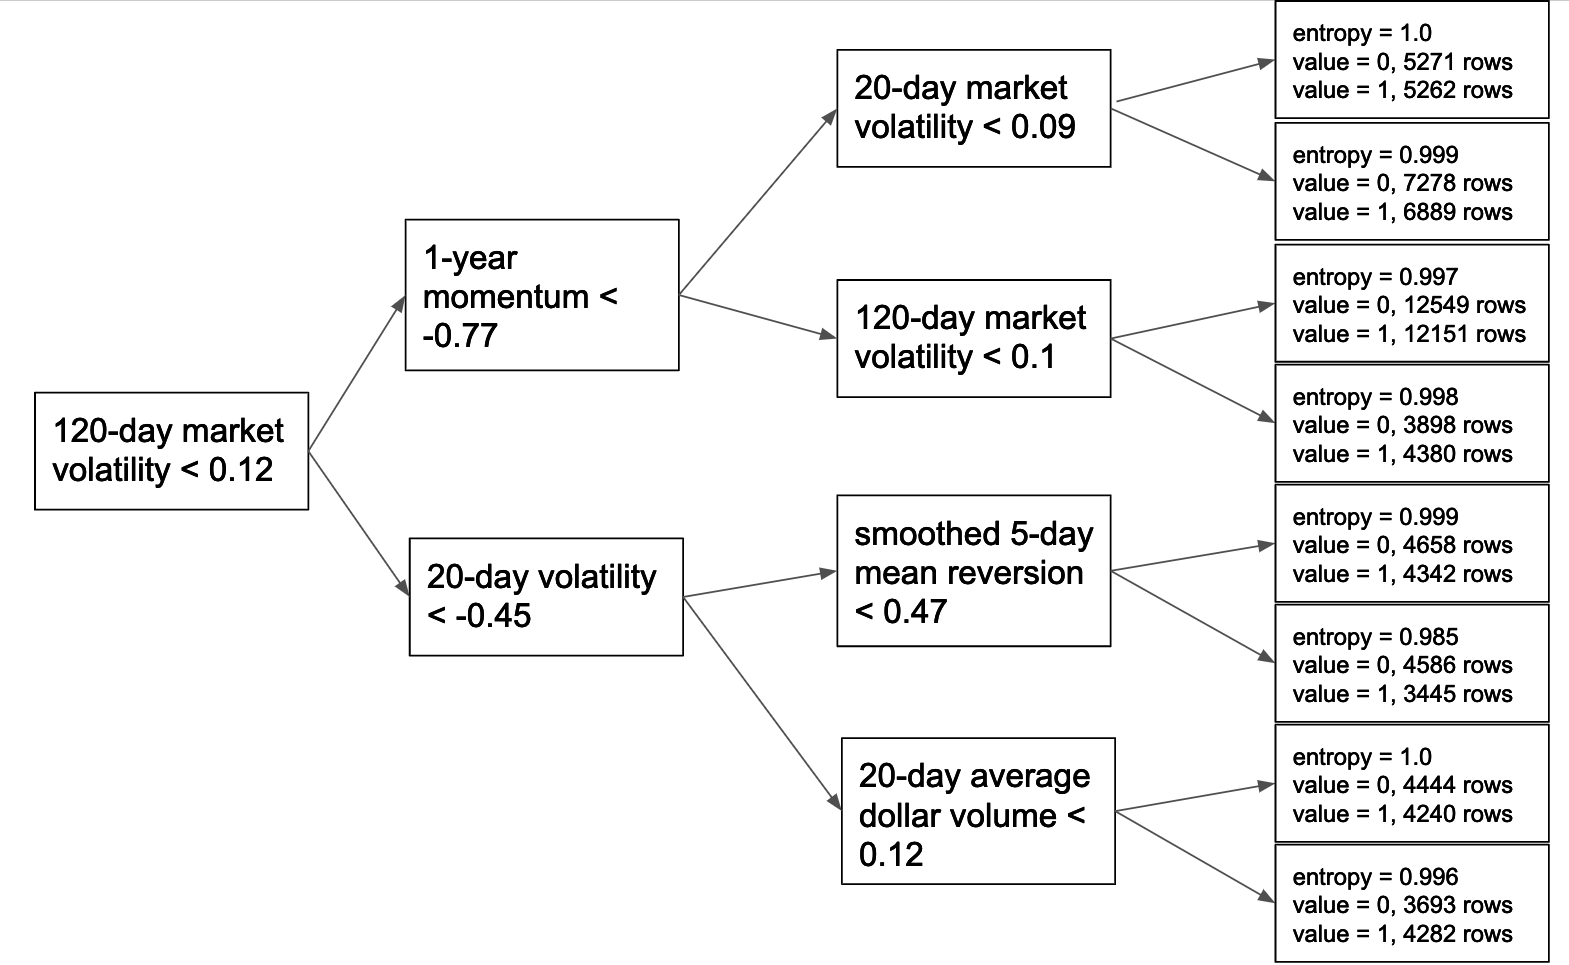
    What features are typically dominant? Classical, price-driven factors, like mean reversion or momentum factors, often dominate. You may also see that features that define industry sectors or market “regimes” (periods defined, for example, by high or low market volatility or other market-wide trends) are towards the root of the tree.
    典型地,价格驱动的因子(例如均值回归或动量因子)通常占主导地位。 您还可能会看到,定义行业部门或市场“制度”的特征(例如,由高或低的市场波动性或其他市场趋势确定的时期)都会靠近树的根部。

    Choosing Hyperparameter Values / 选择超参数

    In non-financial and non-time series machine learning, setting this hyperparameter is fairly straightforward: you use grid search cross-validation to find the value that maximizes the model’s performance on validation data. When you have time-series data, you typically don’t use cross-validation because usually you just want a single validation dataset that is as close in time as possible to the present. If you have a problem with high signal-to-noise, then you can try a bit of parameter tuning on the single validation set. In finance, though, you have time series data and you have low signal-to-noise. Therefore, you have one validation set and if you were to try a bunch of parameter values on this validation set, you would almost surely be overfitting. As such, you need to set the parameter with some judgement and minimal trials.
    在非金融和非时间序列的机器学习中,设置超参数非常简单:您可以使用网格搜索交叉验证来找到使模型在验证数据上的性能最大化的值。当您拥有时间序列数据时,通常不使用交叉验证,因为通常您希望验证集对应的时间越晚越好(译注: 理由可以见这里)。如果信噪比过高,可以在单个验证集中尝试一些参数调整。但是,在金融领域,您有时间序列数据,信噪比也很低。鉴于只有一个验证集,如果要在此验证集上尝试一堆参数值,则几乎肯定会过拟合。因此,您需要通过一些判断和最少的尝试来设置参数。

    Random Forests for Alpha Combination / 用于Alpha组合的随机森林

    rf-for-alpha-combination.png

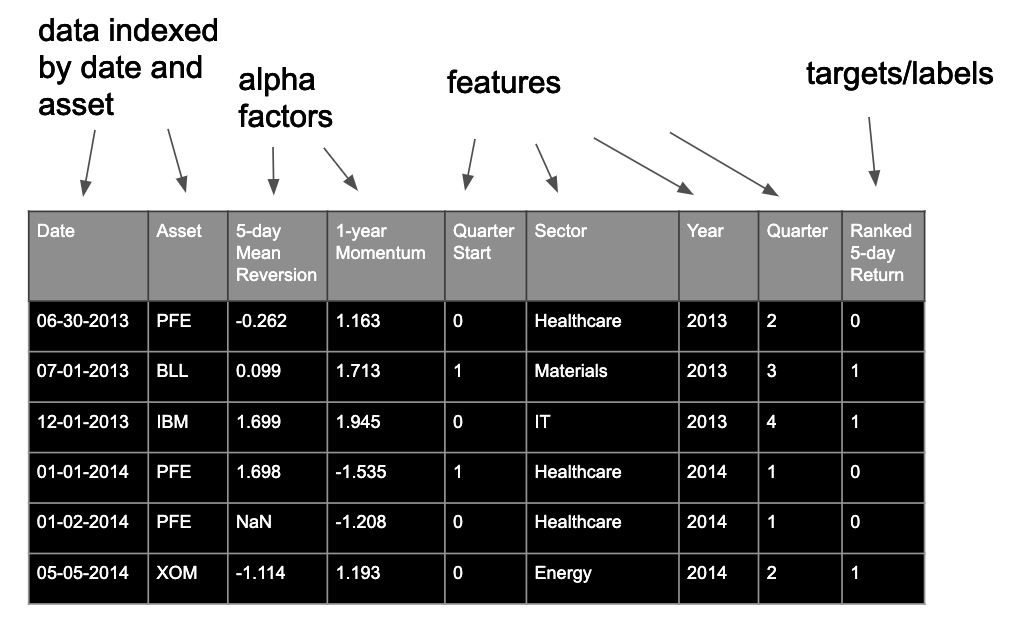
    For this type of problem, we have data that look like the above. Each row is indexed by both date and asset. We typically have several alpha factors, and we then calculate “features”, which provide the random forest model additional information. For example, we may calculate date features, which the algorithm could use to learn that certain factors are particularly predictive during certain periods.
    对于这种类型的问题,我们有类似上面的数据。 每行都按日期和资产编制索引。 通常,我们有几个alpha因子,然后我们计算“特征”,这些特征为随机森林模型提供了其他信息。 例如,我们可以计算日期特征,该算法可用于了解某些因素在某些时期特别具有预测性。
    example-finance-tree.png
    What are we trying to predict? We’re trying to predict asset returns—but not their decimal values! We rank them relative to each other into only two buckets, such that we essentially predict winners and losers on the day. T
    我们要预测什么? 我们正在尝试预测资产收益,但不能预测其十进制值! 我们将它们彼此相对地分为两个等级,这样我们就可以基本上预测当天的赢家和输家。


    Source: AI for Trading, Udacity

  • Validation for Financial Data 金融数据的验证集

    Furthermore, when working with financial data, we can bring practitioners’ knowledge of markets and financial data to bear on our validation procedures. We know that since markets are competitive, factors decay over time; signals that may have worked well in the past may no longer work well by the current time. For this reason, we should generally test and validate on the most recent data possible, as testing on the recent past could be considered the most demanding test.
    此外,在处理财务数据时,我们可以使从业人员对市场和财务数据的了解可用于我们的验证程序。我们知道,由于市场竞争激烈,因此因素会随着时间而衰减。过去可能效果良好的信号可能在当前时间不再有效。因此,我们通常应该对最新数据进行测试和验证,因为对最近历史的测试可能被认为是最苛刻的测试。

    It’s possible that the design of the model may cause it to perform better or worse in different market regimes; so the most recent time period may not be in a market regime in which the model would perform well. But generally, we still prefer to use most recent data to test if the model would work in the time most similar to the present. In practice, of course, before investing a lot of money in a strategy, we would allow time to elapse without changing the model, and test its performance with this true out-of-sample data: what’s known as “paper trading”.
    模型的设计可能会导致它在不同的市场体制下表现更好或更差。因此,最近的时间段可能不在该模型可以正常运行的市场体制中。但总的来说,我们仍然倾向于使用最新数据来测试该模型在与当前时间最相似的时间内是否可以正常工作。当然,实际上,在实践中,在为策略投入大量资金之前,我们会花些时间而不更改模型,并使用此真实的样本外数据(即所谓的“纸面交易”)测试其性能。

    In summary, most common practice is to keep a block of data from the most recent time period as your test set.
    总之,最常见的做法是将最近一段时间内的数据作为测试集

    Then, the data are split into train, valid and test sets according to the following schematic:
    然后,根据下图将数据分为训练集,验证集和测试集:
    train-valid-test-time-2.png

    When working with data that are indexed by asset and day, it’s important not to split data for the same day, but for different assets, among sets. This would manifest as a subtle form of lookahead bias. For example, say data from Coca-Cola and Pepsi for the same day ended up in different sets. Since they are very similar companies, one might expect their share price trends to be correlated. If the model were trained on data from one company, and then validated on data from the other company, it might “learn” about a price movement that affects both companies, and therefore have artificially inflated performance on the validation set.
    当使用按资产和日期索引的数据时,重要的是不要在同一天中将同一种资产的数据分到一组,而是将不同资产的数据分到一组内。 这将表现为超前偏差的微妙形式(译注:某种程度上像是利用了未来数据)。 例如,说来自可口可乐和百事可乐的同一天的数据以不同的集合结束。 由于它们是非常相似的公司,因此人们可能希望它们的股价趋势相互关联。 如果模型是根据一个公司的数据进行训练的,然后根据另一公司的数据进行验证的,则它可能会“了解”会影响两家公司的价格变动,因此会人为地夸大验证集上的绩效。


    Source/来源: AI for Trading, Udacity